## start normative comparions
cat('docu','ment.','title = "MNC";','',sep="");
normvals <- function (bb,nvar) {
bb=as.data.frame(bb)
bbsd=sqrt(diag(cov(bb)))
bbicov=matrix(as.numeric(solve(cor(bb))),nvar,nvar)
bbmn=mean(bb)/bbsd
return(list(mean=bbmn,sd=bbsd,icov=bbicov))
}
normvalsred <- function (bb,nvar) {
bb=as.data.frame(bb)
bbsd=sqrt(diag(cov(bb)))
bbmn=mean(bb)/bbsd
return(bbmn)
}
normstat<- function(aa){
l=length(aa)
g=(l+1)/l
t=mean(aa)/(sqrt(var(aa)*g))
return(t)
}
hotstat <-function(aa,covaa_inv,nvar,nnorm){
ht=(t(aa)%*%covaa_inv%*%aa)/((nnorm+1)/nnorm)
ht=ht*(nnorm-nvar)/(nvar*(nnorm-1))
return(ht)
}
tmaxstat <-function(aa,nvar,nnorm){
g=(nnorm+1)/nnorm
t=c(rep(0,nvar))
for (i in 1:nvar) t[i]=aa[i]/(sqrt(g))
tmaxstat=max(abs(t))
return(tmaxstat)
}
tstat<- function(aa,nnorm) {
g=(nnorm+1)/nnorm
t=aa/(sqrt(g))
return(t)
}
myformatC <- function(x, ..., range=c(0,.05), prefix='', postfix="*") {
idc = x>=min(range) & x<=max(range)
n = length(strsplit(prefix,'')[[1]])
paste(ifelse(idc,prefix,""), formatC(x, ...), ifelse(idc,postfix," "), sep="")
}
detach(X)
.X = X
X[,2] = as.character(X[,2])
labels = table(X[,2])
if(length(labels)>2) cat('<','/pre>','<','pre style="color:red;font-weight:900;">','There are more than two group-labels, largest group is taken as controls, others are treated as patients','','pre>','<','pre style="display:none">',sep="")
if(length(labels) < 2) {cat('','pre>','<','pre style="color:red;font-weight:900;">','All cases come from the same group! No tests performed','','pre>','<','pre style="display:none">',sep=""); q();}
print(labels)
labels = names(sort(labels,decreasing=TRUE))
if(!exists('indicnorm')) indicnorm = '1'
cat('indicnorm = ', indicnorm,"\n");
control.group = X[,2] == indicnorm; #labels[1]
X[,2] = as.vector(X[,2])
X[ control.group, 2] = "1"
X[!control.group, 2] = "0"
X[,2] = as.numeric(X[,2])
print(X)
cat("\n\nnumber of samples for max-t statistic:",resamplesize,'\n')
resamplesize = if(!exists('resamplesize')) 1000 else tryCatch(as.numeric(resamplesize), warning=function(...) 1000) # minimum resample size is 1000
resamplesize = min(resamplesize, 50000) # maximum of 50,000 resamples to prevent server overload
cat("\n\nnumber of samples for max-t statistic:",resamplesize,'\n')
Yo = X
Y = X = na.omit(X)
X = rbind(X[X[,2]==1,],X[X[,2]==0,])
#if(sum(X[,2]==1)0)) cat('{/pre}','{pre}','There seems to be a problem with the data. Indeterminate variances observed in control group.','{/pre}','{pre style="display:none;"}');
normsd=sqrt(diag(cov(normdat)))
normicov=matrix(as.numeric(solve(cor(normdat))),nvar,nvar)
normmea=as.numeric(mean(normdat))
normmea=normmea/normsd
# create bootstrap distribution function from norm group data
nsamp = resamplesize #number of permutations
nnorm = nrow(normdat)
cnormdat = scale(normdat, center=TRUE, scale=FALSE) # centered norm data
#cnormdat = normdat-mean(normdat) ##$@% dit klopt niet!!!!!! moet scale(normdat,scale=FALSE) zijn
tmaxboot = replicate(nsamp, tmaxstat(normvalsred(sample(c(-1,1),nnorm,TRUE)*cnormdat,nvar),nvar,nnorm))
tmaxboot=tmaxboot*sqrt(nnorm+1)#multiply distribution for normative comparison
ptmaxboot = ecdf(tmaxboot)
#plot(ptmaxboot)
#prepare output
resultmat=matrix(c(rep(0,(nvar+1)*2)),(nvar+1),4)
row.label=c(data.n[3:(nvar+2)],'MULTIVARIATE')
col.label=c('DIFFERENCE','P-VALUE','P-VALUE (uncorrected)','P-VALUE (resample)')
col = rep('gray',nrow(X))
patidx = as.numeric(as.factor(X[,2]))==1
patcol = substr(terrain.colors(sum(patidx)+2),1,7);print(patcol)
col[patidx] = patcol
cex = rep(1,nrow(X))
cex[patidx] = 1.5
for(i in seq(3, ncol(X), by=3))
plot(X[,(i+0:4)[i+0:4<=ncol(X)]],col=col, pch=c(1,17)[patidx+1],cex=cex,main="Scatterplot of the data (patients are color coded)")
if(!is.null(attr(Y,'na.action'))){
cat('<','/pre>')
tmpX = Yo[attr(Y,'na.action'),]
rownames(tmpX) = paste('row',attr(Y,'na.action'))
cat('<','pre style="background:#dfa;width:100%;border: solid 1px black;position:relative;top:-0pt;"}','<','pre style="padding-left:2cm;position:relative;top:-12pt">', 'Some cases had missing values. These were removed from the data.\nThe cases removed are in rows\n\t',paste(attr(Y,'na.action'),collapse=', '),'\nThe rows corresponding to these cases are\n\n'); print(tmpX);cat('<','/pre>','<','/pre>\n','<','pre style="display:none;">')
}
X2=X;X2[X[,2]==1,2]=labels[1]; X2[X[,2]!=1,2]=labels[2];
#
cat('','pre>',sep="");cat('<','pre style="background:#ddd;width:100%;border:solid 1px black;padding:5pt;padding-left:46pt;">The data read*:\n\n(* reordered so that individuals in the norm group come first)\n\n',sep='');print(X2);cat('','pre><','pre style="display:none;"',sep='')
#
#
#
cat('','pre>',sep="");cat('<','pre style="background: #eee;border: solid black 1px;">',sep=""); cat('\n\n\tMULTIVARIATE COMPARISON');cat("\n\t(as explained in Huizenga et al. (2007) Neuropsychologia, 45, 2534)\n\n");cat('\tDIFFERENCE refers to the sum of standardized differences \n\tto the norm (neg indicates a lower score)');cat("\n");cat('\n\tP-VALUE is two-sided, should be lower than 0.05');cat("\n\n\tHotelling's T² is the statistic associated with the p-value and is proportional\n\tto the squared Mahalanobis distance from the normative centroid\n");cat('\n\tOne side comparison?: first check if sum of differences is in expected direction, \n\tif so, then p should be lower than 0.10\n\n');cat('','pre><','pre style="display:none;"',sep='')
#
#
#
#
cat('','pre>',sep="");cat('<','pre style="background: #eee;border: solid black 1px;">',sep="");cat('\n\n\tUNIVARIATE COMPARISONS\n\n'); cat('\tDIFFERENCE refers to the standardized difference \n\tto the norm (neg indicates a lower score)\n');cat('\n\tUNCORRECTED are p-values not corrected for multiple\n\tcomparisons.');cat("\n\n");cat('\tBONFERRONI are corrected for multiple comparisons with the\n\tBonferroni method. The method is explained in this paper.\n\n\tRESAMPLE are corrected for multiple comparisons with the\n\tresampling method. The method is explained in this paper.\n\n\tBoth Bonferroni and RESAMPLE control the false positives,\n\tyet RESAMPLE has a larger power to detect differences,\n\ttherefore RESAMPLE shoul be preferred over Bonferroni.\n\n\tTwo sided comparisons: the p-value should be lower than 0.05\n\tOne side comparisons: first check if difference is in expected direction, \n\tif so, then p should be lower than 0.10.\n\n');cat('','pre><','pre style="display:none;">',sep='')
#
#perform normative comparisons
#
hote = data.frame(ID = data.val[nnorm+1:nindiv,1], "Hotelling.T2"=0, df1=0, df2=0, p.value=1)
for (j in 1:nindiv) {
inddat=(as.numeric(data.val[nnorm+j,(-1:-2)]))/normsd #standardize
difdat=inddat-normmea ##rg#
#multivariate
ht=scf1*(t(inddat-normmea)%*%normicov%*%(inddat-normmea))/scf2
resultmat[(nvar+1),3]=resultmat[(nvar+1),2]=pval=1-pf(ht, nvar, nnorm-nvar)
resultmat[(nvar+1),1]=sum(inddat-normmea)
hote[j,2] = ht
hote[j,3] = nvar
hote[j,4] = nnorm-nvar
hote[j,5] = pval
rnam = row.names(resultmat)
# resultmat = rbind(resultmat, resultmat[nvar+1,])
# resultmat[nvar+2,1] = ht
# row.names(resultmat) = c(rnam,"HOTELLING'S T²")
# univariate comparisons
for (i in 1:nvar) {
normivar=1 #since variables are standardized
htu=(((inddat[i]-normmea[i])^2))*normivar/scf2
resultmat[i,3]=1-pf(htu, 1, nnorm-1)
resultmat[i,2]=min(((1-pf(htu, 1, nnorm-1))*nvar),1.0) # Bon
resultmat[i,1]=(inddat[i]-normmea[i])/sqrt(normivar)
}
# tmax statistic
tval=sapply(difdat,function(t) -tstat(t,nnorm)) ##rg# this is the resampling statistic
resultmat[seq(along=tval),4] = ptmax = pmin(1-ptmaxboot(tval)+ptmaxboot(-tval),1) # proportions of bootstrap tmax's >= abs(tval)
resultmat[nrow(resultmat),4] = resultmat[nrow(resultmat),3]
## print(cbind(tval,ptmax))
# print output
resultmat=data.frame(resultmat,row.names = row.label)
colnames(resultmat)=col.label
## print(myformatC(resultmat[,3],digits=3,format='f',width=11));
mat = noquote(cbind(
DIFFERENCE=formatC(resultmat[,1],digits=3,format='f',flag=" ",width=10),
MULTIVARIATE=formatC(resultmat[,2],digits=3,format='f',width=12),
"BONFERRONI"=myformatC(resultmat[,2],digits=3,format='f',width=10),
"UNCORRECTED"=myformatC(resultmat[,3],digits=3,format='f',width=11),
"RESAMPLE"=myformatC(resultmat[,4],digits=3,format='f',width=8)
))
rownames(mat) = rownames(resultmat)
mat[nrow(mat),3:5] = c(" -- "," -- "," -- ")
mat[-nrow(mat),'MULTIVARIATE'] = ' -- '
cat('','pre>',sep="");cat('<','pre style="background:',patcol[j],';padding:15px"','> ','participant',data.val[nnorm+j,1],'
\n','<','pre style="margin-left:1cm;">',sep=""); print(mat);cat("\nHotelling's T² =",formatC(ht,6)); cat('\n\n','pre><','pre style="display:none;">',sep='')
}
#
#
#
#
cat('
'); hotellingstxt = paste(capture.output(print(hote)), collapse="\n"); cat('','pre>',sep=""); cat('<','button onc','lick="scroll(0,0); window.history.back();" ', 'style="position:relative;left:40%;top:2cm;">do a new analysis',sep=""); hotellingstxt = paste('
',hotellingstxt,'','pre>',sep=''); cat(hotellingstxt); cat('','pre><','pre style="display:none;">',sep='');
#
#
#
cat('\n',sep=""); cat('window.onload = function(){\nvar mydiv = document.getElementById("mydiv");\ndocument.body.innerHTML = '); cat("'Multivariate normative comparisons result
'+mydiv.innerHTML;\ndocument.body.style.color='black';",sep="");cat('}'); cat('\n','script','>',sep="")
#
#
#
#
cat('','','scri','pts>',sep="");
cat('\n', sep=""); cat('_uacct = "UA-121264-1";urchinTracker();\n','','scri','pt>',sep="");
#
#
cat(' var sc_project','=1105991; var sc_','invisible=','1; var sc_par','tition=5; var ','sc_security=','"bd181e3c"; \n',sep="")
#
#
cat('',sep=""); cat('var sc_','project=','4268622; var',' sc_in','visible=1','; var sc_par','tition=46;',' var sc_','click_stat=1;',' var sc_','secur','ity="97c','41369";',sep=""); cat('','scri','pt>',sep="");cat('','','scri','pts>',sep="");
#
#
#
cat('','var sc_pro','ject=4268622; var sc_invisible=1; var sc_partition','=46; var',' sc_click_stat=','1; var sc_security="97c41369"; \n',sep="")
cat('\n',sep="")
Submit Your Data for Analysis
|
Enter a dataset URL:
|
use sample data
|
Paste your data directly:
|
use sample data
|
|
|
OR
|
|
|
Select a local file to submit:
|
|
|
|
|
|
number of resampling draws (more gives for more precise p-values for the maximum t-statistic, but also longer page load times)
| 1000
50,000
|
value in second column that indicates norm group:
|
|
|
|
|
Preparing your data
Uploading your data
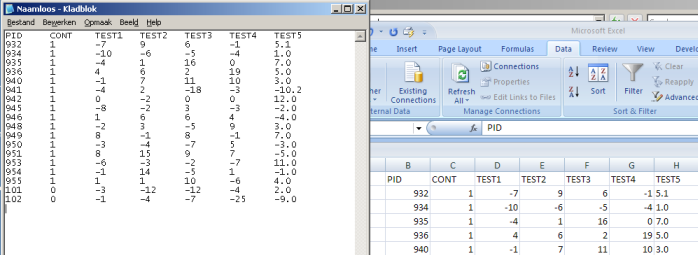
You can either submit a file, or directly copy-and-paste the data from a spreadsheet into the field above. If you wish to submit a file the data should be tabulated in a plain text file, use Notepad, Excel or SPSS to save the file as a plain text file. Note that decimals should be separated by a point, and not a comma (that is, use 1.3 instead of 1,3). The easiest way to prepare your data however is to put them into an Excel sheet, select the entire table, and copy and paste the selection to the field above. Note that Excel uses sometimes decimal comma's instead of decimal points. If so, you can click the button above to replace comma's by points. (This doesn't work when you upload a file!)
Structure datafile
- The first column should contain the participant identifier, and the second should contain an indicator that specifies whether the participant belongs to the norm group or not. Any label can be used (we suggest 1 and 0 or 'control' and 'patient'). Please provide the value by which the norm-group is indicated (defaults to 1).
- The polarity of all tests should be similar, e.g high positive scores should indicate good scores. If this is not the case for a particular test, for example if three tests measure the number of correct items and a fourth test measures the time it takes to complete a task, then the latter test score should be transformed, e.g. by multiplying by minus one.
- Multivariate comparisons require that the number of individuals in the norm group exceeds the number of variables, so make sure that this requirement is met
|
This software accompanies the paper
Huizenga, H.M., Smeding, H., Grasman, R.P.P.P., & Schmand, B. (2007). Multivariate normative comparisons. Neuropsychologia, 45, 2534-2542.